THM write-up: Forensics
8 minutes to read
Link: https://tryhackme.com/room/forensics
Another day, another write-up on tryhackme challenge. Today, I going to show you a forensic challenge created by user whiteheart. This forensic challenge is a bit special when compared with the last CTF challenge. This challenge is about finding information inside a memory dump. For your information, there is a lot of forensic tools available on the Internet and volatility is one of the forensic tools that specialized in-memory analysis. The memory that I referred here is Random Access Memory (RAM) a.k.a volatile memory. An image of the volatile memory can hold various information that can help with an investigation. Information such as services, network activity, processes, user activity, and even password can be found within the image. For this instance, I am going to use the pre-installed volatility forensic tool inside the Kali Linux.
Task 1: Information gather
Task 1-1: Download the image file
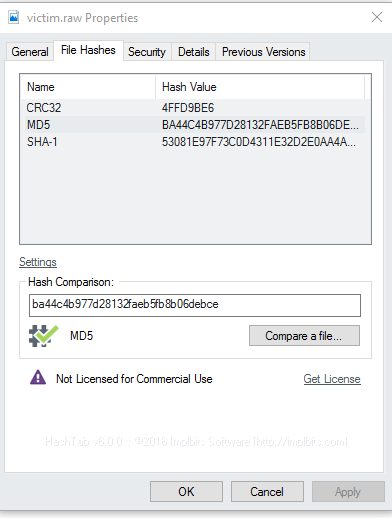
First and foremost, download the image file before proceeding the challenge. The file size is about 438,371 KB. Make sure the unzipped image file match the given MD5 hash.
Task 1-2: Identify the OS
After that, launch your volatility help menu with the following command.
volatility -h
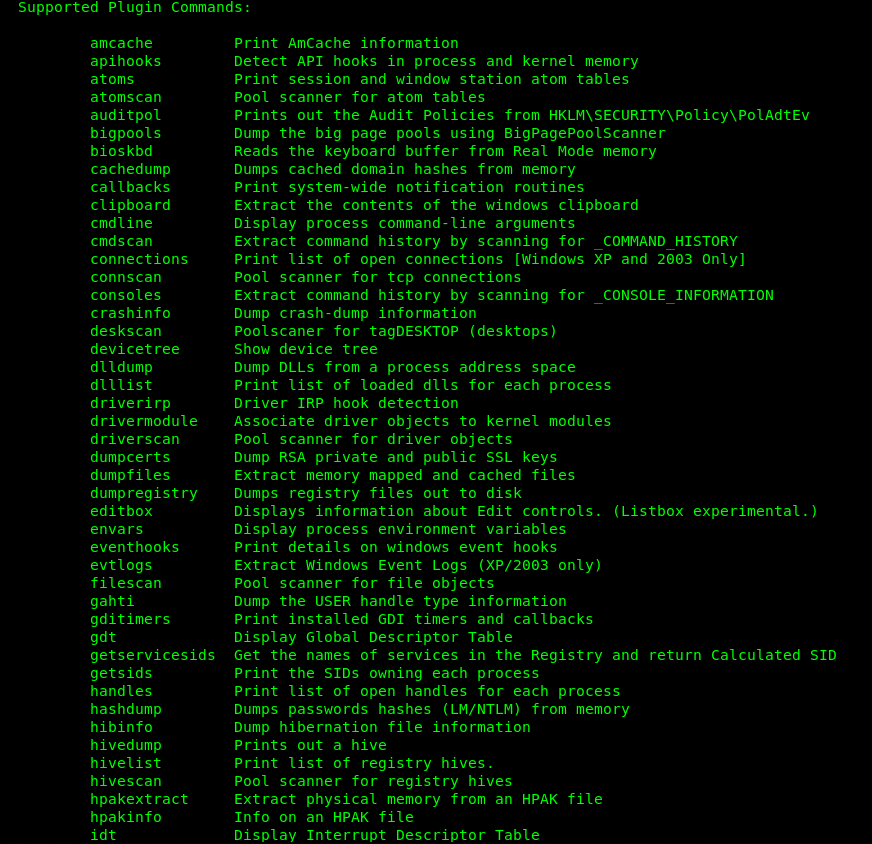
Scroll down the terminal and you will see tons of plugin commands. These commands are important as we are going to use it throughout the entire challenge. It is better if you roughly go through the commands and the description.
To perform the first scan on the memory image, we are going to use the following command.
volatility -f victim.raw imageinfo
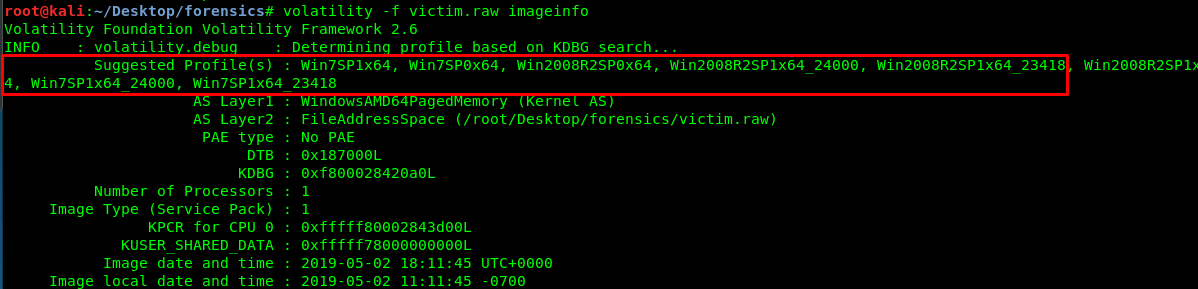
After a jiff, the image’s information will be presented on your terminal. It seems that the victim is running on windows OS. However, we are unable to determine the exact Windows version where it can be either Windows 7 or Windows Server 2008. Either way, the result does not affect our next task.
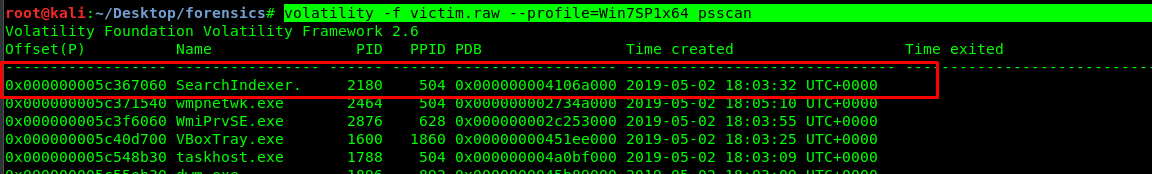
Task 1-3: Looking for ‘SearchIndexer’ PID
You can either use ‘pslist’ or ‘psscan’ to complete this task. The difference is pslist only lists out the running process while psscan scan and list out all the running and terminated process.
volatility -f victim.raw --profile=Win7SP1x64 pslist
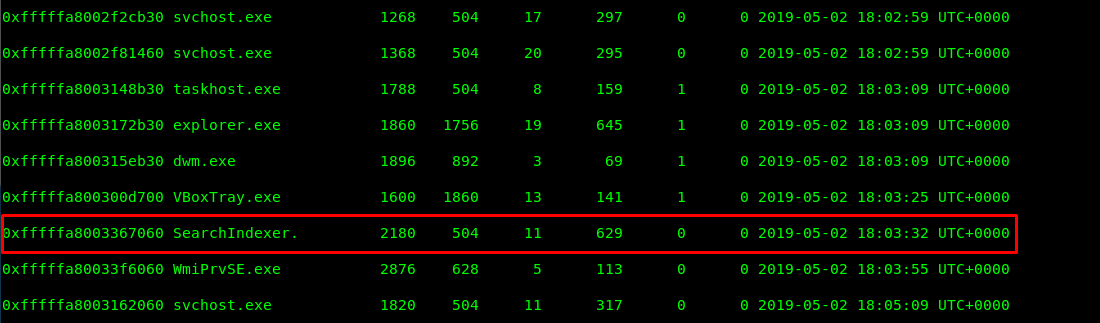
volatility -f victim.raw --profile=Win7SP1x64 psscan
Task 1-4: Last accessed directory
‘Shellbags’ plugin command can be used to gather all the information about a viewed directory such as size, position, and icon. Using this command, we are able to track down the folder accessed by the user. Hence, it reduced the search time.
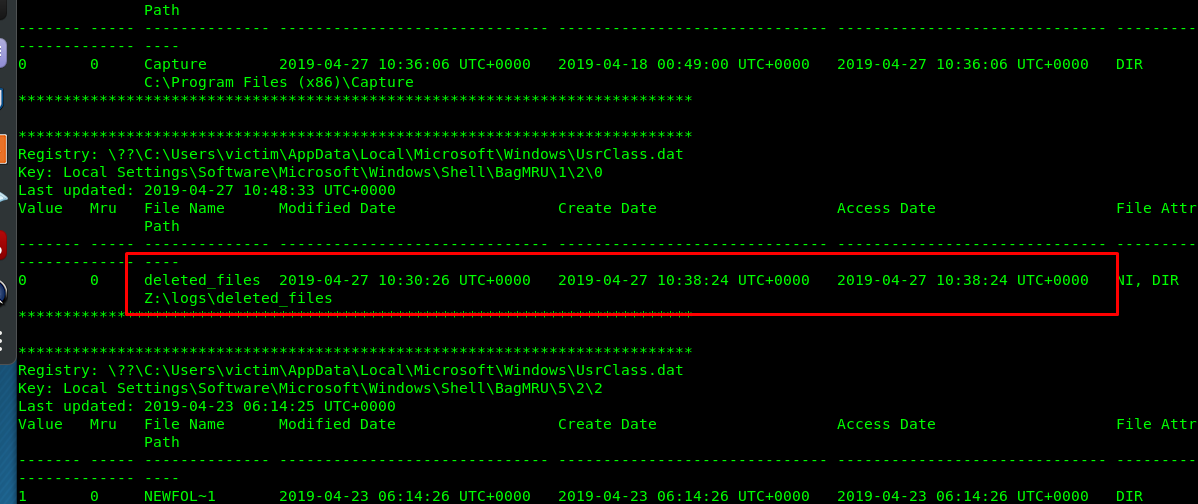
The ‘deleted_file’ is the last directory accessed by the user.
Task 2: Search for malicious processes
I am going to dig a little deeper on the memory image. This time we are going to look for the malicious processes running on the victim’s machine.
Task 2-1: Suspicious ports
By looking at the volatility help menu, you are supposedly able to scan the open port using ‘connections’ and ‘connscan’. However, both plugin commands only restricted to Windows XP and Windows server 2003. Luckily I found another way to scan the open ports using ‘netscan’ after reading this article. Let ‘s scan the open port using the following command
volatility -f victim.raw --profile=Win7SP1x64 netscan
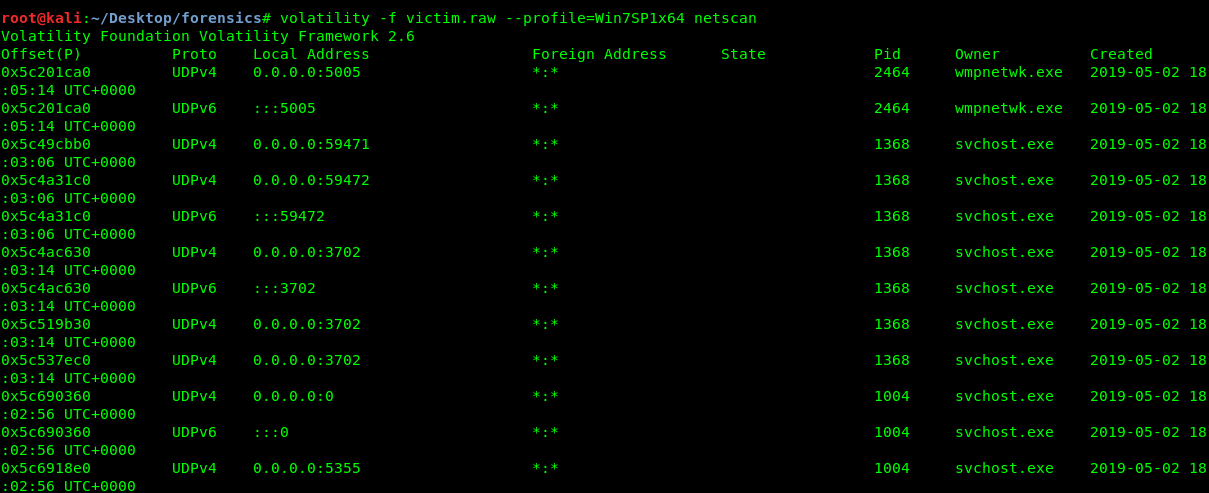
After that, I summarized the scan in the table below.
| PID | Open port | Comment |
|---|---|---|
| 4 | TCP:5357, TCP:445, UDP:138, UDP:137,TCP:2869 | System open port |
| 416 | TCP:49152 | |
| 504 | TCP:49156 | |
| 512 | TCP:49155 | |
| 752 | TCP:135 | samba |
| 688 | vbox | |
| 852 | TCP:49153 | |
| 920 | TCP:49154 | |
| 1004 | UDP:5355 | |
| 1368 | UDP:59471, UDP:59471, UDP:3702, UDP:1900, UDP:61556, UDP:61555 | suspicious |
| 2464 | UDP:5005, UDP:5004, TCP:554 | suspicious |
Looks like PID 1368 and PID 2464 with multiple ports which look suspicious to us. How about the PPID of both processes?
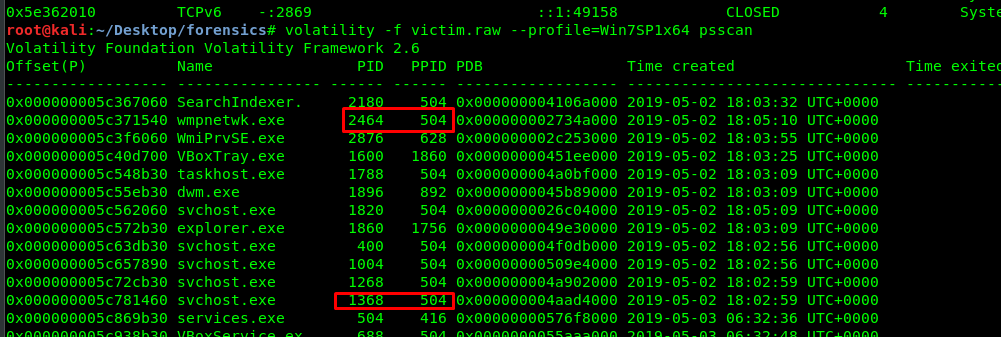
Both processes are came from the same PPID. Definitely suspicious.
Task 2-2: Another suspicious process
We have identified PID 1368 and PID 2464 are malicious processes. There are other malicious processes still hiding inside the memory file which is yet to be discovered by us. How about revisiting the psscan?
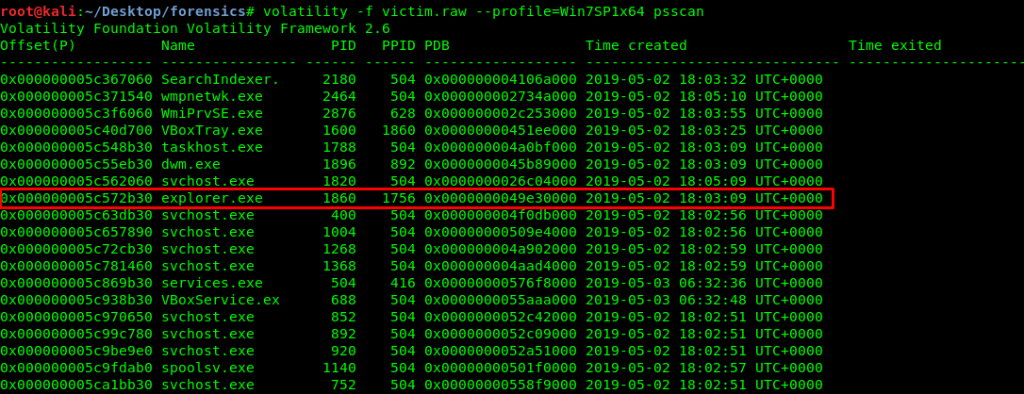
The explorer.exe process is a suspicious process. This is because of the PPID of the explore.exe is nowhere to be found in the PID. Which process started the explorer.exe? The answer is unknown. However, this can not conclude that explorer.exe is a malicious process. How about we check for the process command line?
volatility -f victim.raw --profile=Win7SP1x64 cmdline

Look like the explorer.exe execute in the correct directory. How about dump the process and check with Virus total?
volatility -f victim.raw -p 1860 --profile=Win7SP1x64 procdump <Directory to save the file>
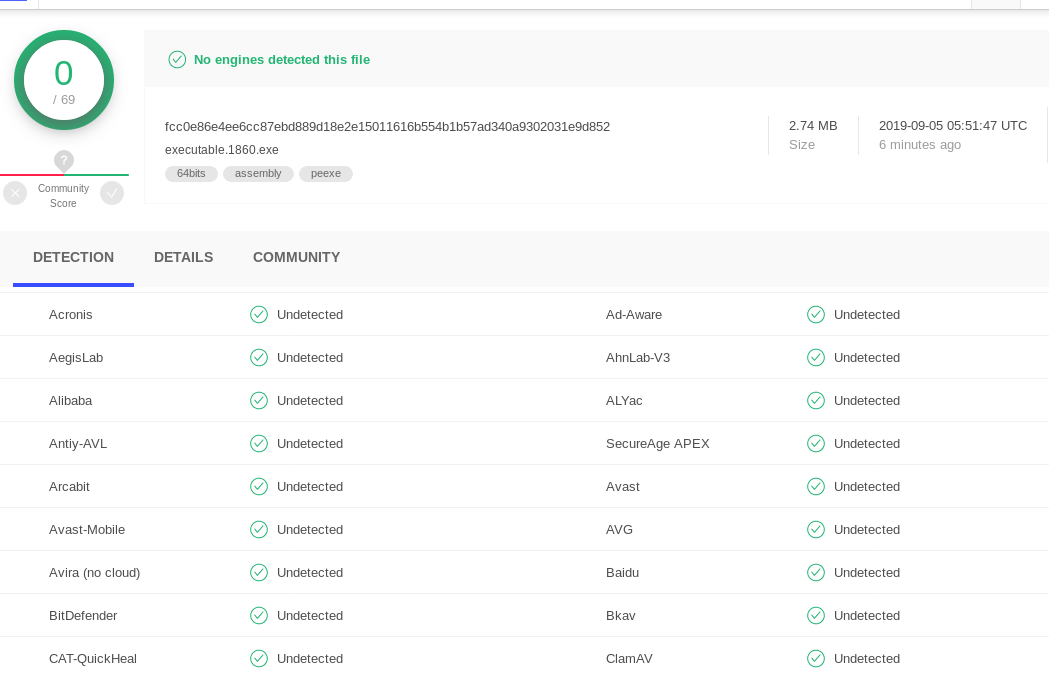
The file is clean on Virus total scan. Is this the end? Well, I don’t think so. There is another plugins command to check for the malware inside the memory file. The command named as ‘malfind’
volatility -f victim.raw --profile=Win7SP1x64 malfind
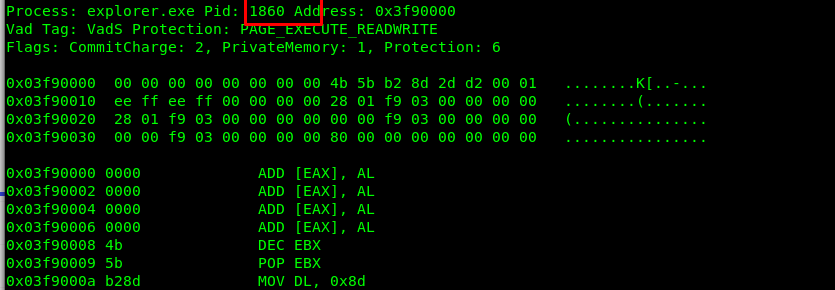
Now we are talking. The explorer.exe is executing protection which indicates the process is malicious. In the process of checking the malfind log, I stumble across PID 2464 which double confirm our previous finding. In addition, PID 1820 shows malicious sign. We are now identified four malicious PID which are 1368, 1464, 1860 and 1820.
Task 3: Indicators of compromise (IOC)
IOC are pieces of forensic data found inside the system entries log and files. This data is then used to identify malicious activity. Since we have identified all the malicious process on the previous task, we can dump the memory of to process to identify the malicious activity. We can dump the memory using the following command
volatility -f victim.raw -p <malicious PID> --profile=Win7SP1x64 memdump <Directory to save the file>
Out of 4 malicious dump files, we are only interested in 1820.dmp. This is because of the dump file answering all the questions in the following tasks.
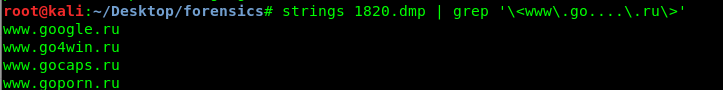
Task 3-1: The first URL
With the given hint, you can easily obtain the answer using grep wildcard.
strings 1820.dmp | grep '\<www\.go....\.ru\>'
Task 3-2: The second URL
Similarly to the previous task.
strings 1820.dmp | grep '\<www\.i....\.com\>'

Task 3-3: The third URL
Similarly to the task 3-1.
strings 1820.dmp | grep '\<www\.ic......\.com\>'

Task 3-4: The first IP address
I guess you know the way.
strings 1820.dmp | grep '\<202\....\.233\....\>'

The second IP address
I don’t have to repeat it again.
strings 1820.dmp | grep '\<...\.200\...\.164\>'

Task 3-6: The third IP address
You know what to do.
strings 1820.dmp | grep '\<209\.190\....\....\>'

Task 3-7: The unique environment variable
To check with the environment variable from the memory image, you can use envars plugin command on PID 2464.
volatility -f victim.raw -p 2464 --profile=Win7SP1x64 envars
We found something extraordinary from the environment variable.
Conclusion
That’s all for the forensics challenge with volatility tools. In this forensic challenge, we learn how to extract information from the memory dump, analyse the malicious process and extracting domains from the dump file. Hope you enjoy the write-up. Until next time ;)
tags: tryhackme - tutorial - memory_dump - volatilityThanks for reading. Follow my twitter for latest update
If you like this post, consider a small donation. Much appreciated. :)